From Data Silos to Enterprise Insights

John Q. Todd
Sr. Business Consultant/Product Researcher Total Resource Management (TRM), Inc.
September 9, 2025
It is commonly accepted that nearly all enterprises have important data stored in multiple locations and multiple formats. As each of the key operational functions is carried out, the volume of collected data about the function grows and needs to be stored somewhere.
Eventually someone, usually upper management, will need to gain insight into the totality of the data, not just a specific silo. While it is admirable that the Purchasing function maintains a reasonable service level to the organization, how does that measure impact the Maintenance side of the house which seems to be struggling? Connecting (perhaps virtually) these separate data sets together can deliver the insights needed by management to make informed decisions.
Goal Setting or Understanding
Put aside for the moment the long list of data sources across the organization and focus on the few measures that are used to determine if the organization is “on track,” or not. It is highly likely that these measures are largely financially focused. Stop right here. Put in the back of your mind as you look at the data in the silos that the ultimate measure of “success” is most likely largely financial in nature. How does the data in the silos reflect financial elements?
Back to the organizational goals. What data is used to support the measurement of the goals? Where is this data stored, who “owns” it, and how often does the data need to be reported or used? Is there a need for real-time estimations, or is a monthly/quarterly “after the fact” type of report sufficient?
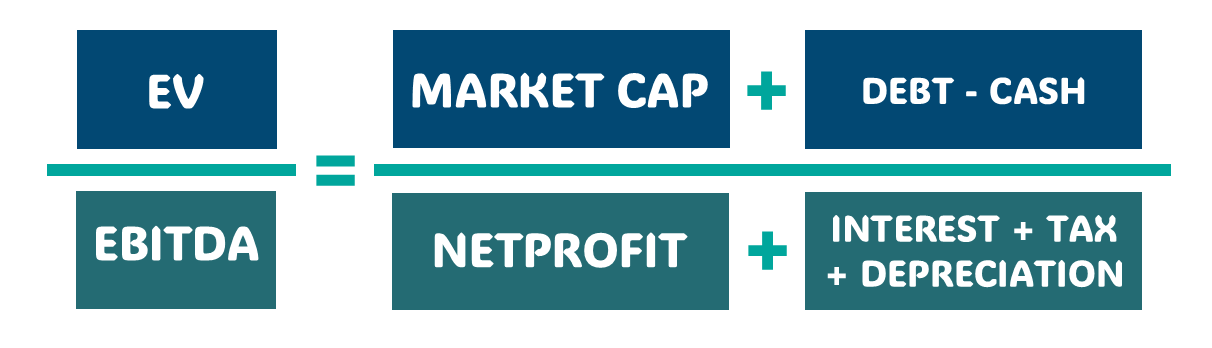
A commonly used (yet argued about) factor to measure company value is EBITDA (Earnings Before Interest, Tax, Depreciation, and Amortization). Since Enterprise Value (EV) represents the total value of a company, including debt and excluding cash, one way to assess a company’s worth is to divide EV by EBITDA. This ratio provides a valuation metric that reflects the company’s value relative to its core earnings. This is just one of many measures that senior management considers when making decisions and evaluating the costs of strategic initiatives.
The question becomes: how does the data that is isolated in silos affect financial measures at this level? The answer may be only a very small amount, perhaps insignificant. (Perhaps hard to accept, but your silos’ budget that you work so hard to maintain might just be a rounding error at the corporate level.) However, if the impact of costs in the silos is significant enough to move the EV or EBITDA needle, then those sources of data need to have more focus than they have had in the past. One could argue that these data sets are intellectual property of the company with significant value.
The path between a corporate goal and a source of silo data may not be direct and may require several transformation steps. Yet, if the connection is important, effort should be made to straighten the path and to make the raw data more reliable, giving higher levels of confidence in the produced insights.
In the end, each data element that a goal is reliant upon, and the calculations used to produce the results should be clearly documented and well understood by those looking for insights and providing the data.
Collecting Data
Now that the goals are well known, as are the sources of data that support them, it is wise to look at how the data is collected. It can be surprising to discover how manual the process of gathering this important data still is. Further, the method of collection may be introducing errors into the data, in turn and perhaps unknowingly making the data produce misleading results.
An ongoing consideration should be looking to automate the collection of data to the highest extent possible. Since the goals are well known, as is the data needed to support them, then it is of great value to reduce the need for human manual data entry or transformation. If the data quality and completeness is reliant upon field staff remembering to do the entry, the efficacy of the data set is in jeopardy.
This notion introduces the need for a degree of risk management around data collection. There is always a probability of collecting “bad” data… or missing the collection of important data… and each data element/set has a “criticality” to the organization. These two elements infer a risk position for the data, which can be managed.
Reduce the risk of collecting bad data (or missing data) by automating the process, making it as seamless as possible for the folks at the tip of the spear going about their business. Thoughtful application design (both on the desktop and mobile) as well as embedded business rules such as pre-set dropdown lists, required fields, record lifecycle shepherding (workflows), all have dramatic impact on the quality of collected data.
An example of a well thought out mobile application is one that presents the user with a list of the work to be performed today. The work at the top of the list is the first to be performed and the user simply pushes the “Start” button to start the clock. The user may pause/restart the work as they go along, and the system is capturing these windows of “actual” labor time spent. When the work is complete, the user pushes “Complete” and the final actual labor entry is entered for them. The user can then, as needed, select materials used and other elements of the work with pre-formed and contextually correct drop-down lists. In this scenario, the user is capturing valuable data while they are simply performing their work. No “extra” data needs to be forgotten about.

Data Analysis and Visualizations
In between the raw data and the corporate goals is the analysis process and the tools used to perform the analysis and present results. There can be entire departments dedicated to this role and they require specialized skills and experience to produce useful results. Modern analysis tools, including those with Artificial Intelligence functionality, continue to make leaps and bounds in usefulness and approachability by wider audiences.
There is no shortage of analysis tools on the market, and most analysts will have 2 or 3 favorites. Yes, it is true, to get the results you are looking for may require the use of several tools. Microsoft PowerBI, IBM Cognos, Tableau, etc. are very powerful tools in the hands of a skilled analyst. These tools also have visualization functions and mobile applications to deliver results to decision-makers in near-real-time or in an updated fashion.

This raises an important question: What is the best format to deliver data visualizations to the people who need them? Maybe a better initial question is to ask “where” the visualizations should be posted to be as highly available to the user community. If the decision-makers are “in” a specific software solution most of their day, then that would be an excellent place for results. If, however, they are walking through the halls most of the day, perhaps a set of monitors in the hallway or a mobile application would be better solutions.
Nearly all modern software solutions have reporting, lists, dashboards, or some other way to visualize results. In general, these solutions are focused on their own data silo. This may be fine for the “local” users of the solution, and these functions should be taken advantage of to support those folks making tactical and local decisions. There is a significant benefit to users in their silos to having access to insights from their own data.
However, the decision-makers who are looking over the entire organization need the same level of access to the data that is important to them. This degree of access will require establishing a data warehouse and the use of analysis tools. Gone are the days when the monthly tabular report was sufficient for this user community. Once the data – analysis – goals paths are established they are repeatable, increasing the efficiency of making decisions.

Where to Begin?
Start with the understanding of the goals and the data source(s) that support them. What then is the connection between these sources of data and the tactical silos of data? Are these silos of data being collected that have no relation to the overall corporate goals? (One could call these “hidden factories” which are always a source of waste.)
Once the connection between goals and data is made, the next step is to focus on how the data is collected. Moving from manual to as fully automated as possible not only saves staff time but cuts down on errors. Modern software solutions easily foster this automation.
The final area to consider is the production and delivery of the analysis results. Given that the analysis process/formulas are well known and documented, the consideration is where/how the results are published. Again, modern analysis tools and other software solutions provide several functions to deliver results to user communities.
The result is a seamless and easy to follow path from the raw data collection, through the analysis, and all the way to the top-most organizational goal visualizations to be used for decision-making.
Wrap Up
TRM has been assisting clients across industries to capture the right data and then use the data to gain insights. With the right tools and strategies in place, executives gain the visibility they need—without overburdening staff with unused reports—empowering leadership to drive higher performance and long-term value. Every client has different needs in this area, but tools such as IBM Maximo and those related provide the foundational functions everyone can use. If your organization is ready to transform data into decisions that matter, Total Resource Management is here to guide the way.
Ready to elevate your asset management?
Connect with TRM to start your journey toward exceptional performance.
Related Resources
Explore insights, guides, and tools designed to help you unlock greater asset management performance and business value.


Unlock smarter
asset management
Ready to elevate your asset management?
Connect with TRM to start your journey toward
exceptional performance.